Revealed… the UK’s fastest-growing new build hot spots
The COVID-19 pandemic has had a significant impact on multiple industries and at the beginning, construction was one of them.
The sector ground to a halt. The pause button was hit on projects. Hard hats, blueprints, power tools, and scaffolding were set aside. That was the case for the majority of spring until the UK began to climb back to its feet.
Around that same time, the Government announced its intention to turn generation rent into generation buy. It cut stamp duty on the sale of new homes and new orders increased at their fastest rate for five years, according to an article published by The Guardian in November 2020.
With construction on new builds back underway and demand for them booming, it got our team thinking, which areas across the country were investing the most in new builds? Where were the UK’s hotspots? And also, which local authorities were the fastest-growing?
After trawling a range of free-to-access data from the Ministry of Housing, Communities, and Local Government which analysed domestic housing construction completed during Q3 2019 and Q2 2020, we found our answer!
Drum roll, please…
So it’s official, Brent, more popularly known as Wembley, has been revealed as the fastest growing location in the UK for housing development!
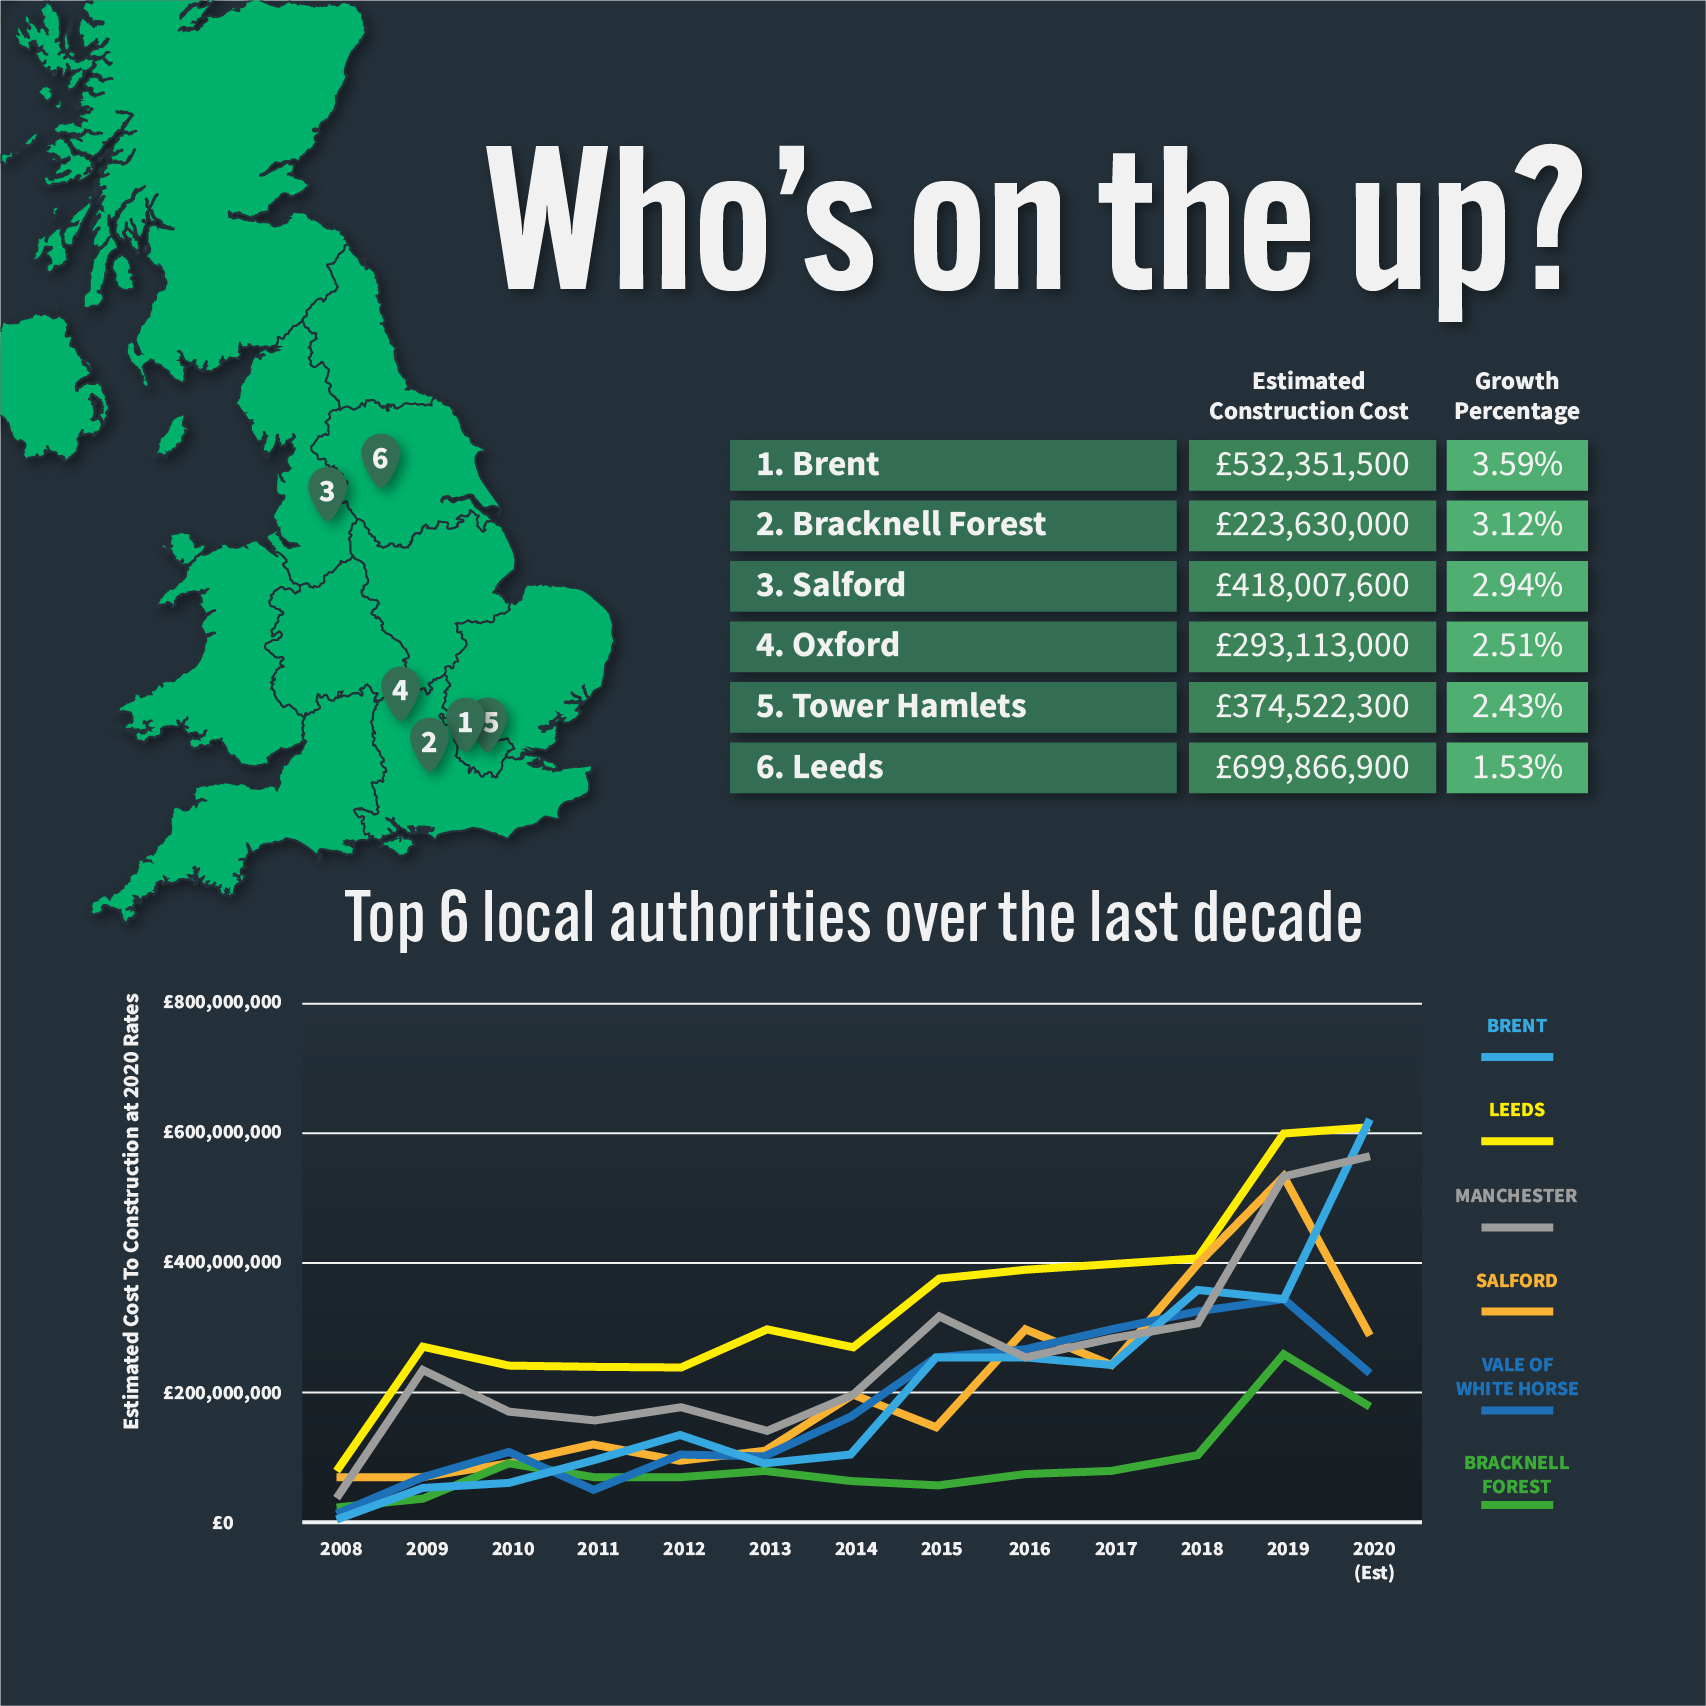
This latest data shows that Brent grew by more than 3.5% during that Q3 2019 and Q2 2020 period and spent an estimated – and eye-popping – £532,351,500 on housing construction.
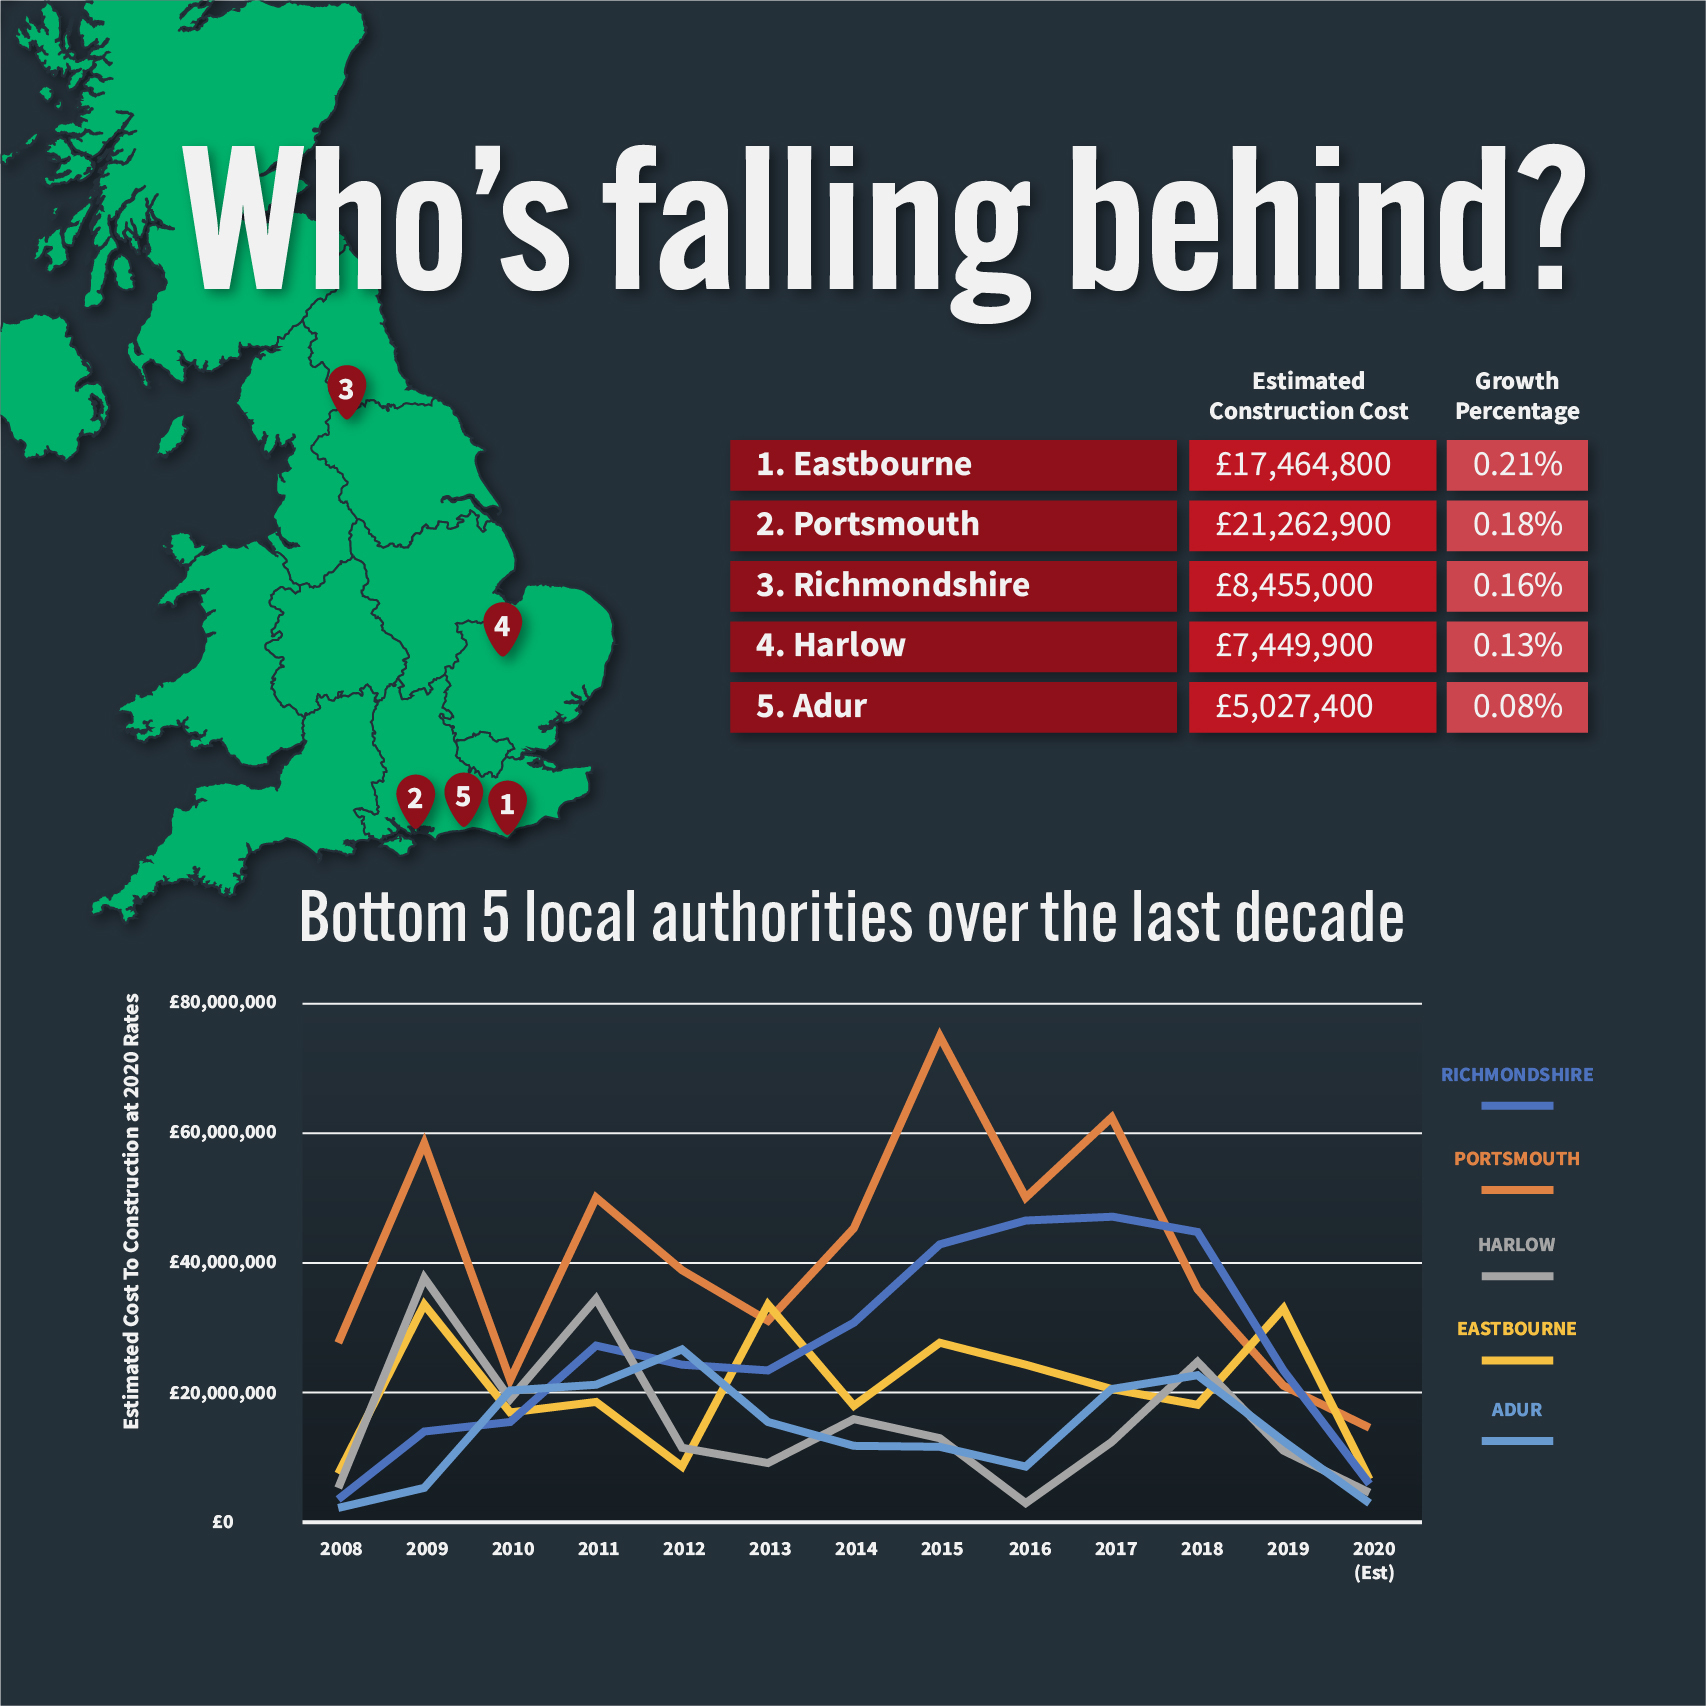
In a league table made up of 308* local authorities, Bracknell Forest (3.12%), Salford (2.94%), Vale of White Horse (2.51%), and Tower Hamlets (2.43%) made up the UK’s top five, while Adur (0.08%), Harlow (0.13%), Richmondshire (0.16%), Portsmouth (0.18%), and Eastbourne (0.21%) found themselves bottom of the pile.
How did we get these percentages, you ask?
The data, acquired from the Ministry of Housing, Communities, and Local Government, takes into account three factors to provide a growth percentage for each of the UK’s local authorities. These are:
- Sum of total floor area (m2)
- Number of new lodgements
- Number of dwellings
Beyond that, the available data also provided an estimated construction cost.
The provided information also dates back to 2008, which showcased how each local authority had grown over a 12-year period up to the end of Q2 2020.
What our managing director had to say?
Analysing this data, Craig Sanders, managing director at Protrade, said: “The COVID-19 pandemic has had a huge impact across a number of sectors, with construction also being hit hard during the first lockdown. However, it has bounced back from its contraction back in Spring 2020 and continues to be one of the main drivers for the recovery of the UK economy.
“Despite difficulties the United Kingdom has faced, there has still been significant demand across the country for new builds, almost certainly helped by the cut of stamp duty. The ongoing lack of affordable housing has also fuelled the requirement for new homes.”
He added: “These numbers make for interesting reading and paints a clear picture of which areas are investing the most in house construction, and ultimately helping to tackle the ongoing UK housing crisis.”
Brent’s growing the quickest but how does that compare to its London neighbours?
So, yes, Brent is the fastest growing area across the UK for housing development. Congratulations! But how does that local authority compare with the rest of the Capital?
We took all 32 London-based local authorities – based on this very official list here – and created a league table from the data that has been collated. This is what we found:
| League table | London’s fastest-growing housing development locations Q3 2019 – Q2 2020 |
||||
| – | Authority | SUM of Total Floor Area (m2) | Estimated construction cost | Number of new houses | Growth (%) |
| 1 | Brent | 280,185 | £532,351,500 | 4,329 | 3.59% |
| 2 | Tower Hamlets | 197,117 | £374,522,300 | 2,953 | 2.43% |
| 3 | Ealing | 151,236 | £287,348,400 | 2,187 | 1.62% |
| 4 | Newham | 133,117 | £252,922,300 | 1,864 | 1.59% |
| 5 | Greenwich | 118,173 | £224,528,700 | 1,640 | 1.43% |
| 6 | Waltham Forest | 101,040 | £191,976,000 | 1,418 | 1.37% |
| 7 | Hounslow | 78,111 | £148,410,900 | 1,361 | 1.34% |
| 8 | Hackney | 104,398 | £198,356,200 | 1,421 | 1.27% |
| 9 | Lambeth | 121,383 | £230,627,700 | 1,709 | 1.21% |
| 10 | Wandsworth | 131,646 | £250,127,400 | 1,683 | 1.14% |
| 11 | Barking and Dagenham | 65,985 | £125,371,500 | 863 | 1.14% |
| 12 | Croydon | 121,959 | £231,722,100 | 1,826 | 1.13% |
| 13 | Westminster | 133,420 | £253,498,000 | 1,377 | 1.10% |
| 14 | Harrow | 64,271 | £122,114,900 | 982 | 1.07% |
| 15 | Hillingdon | 70,277 | £133,526,300 | 1,107 | 1.00% |
| 16 | Hammersmith and Fulham | 69,645 | £132,325,500 | 862 | 0.97% |
| 17 | Barnet | 103,810 | £197,239,000 | 1,197 | 0.78% |
| 18 | Islington | 56,250 | £106,875,000 | 751 | 0.72% |
| 19 | Southwark | 70,104 | £133,197,600 | 961 | 0.71% |
| 20 | Merton | 48,082 | £91,355,800 | 547 | 0.65% |
| 21 | Havering | 45,792 | £87,004,800 | 610 | 0.60% |
| 22 | Camden | 49,899 | £94,808,100 | 601 | 0.57% |
| 23 | Sutton | 34,875 | £66,262,500 | 479 | 0.57% |
| 24 | Redbridge | 42,951 | £81,606,900 | 577 | 0.55% |
| 25 | Haringey | 42,124 | £80,035,600 | 601 | 0.55% |
| 26 | Lewisham | 48,179 | £91,540,100 | 650 | 0.51% |
| 27 | Enfield | 54,139 | £102,864,100 | 598 | 0.47% |
| 28 | Kingston upon Thames | 26,152 | £49,688,800 | 299 | 0.44% |
| 29 | Richmond upon Thames | 39,994 | £75,988,600 | 364 | 0.43% |
| 30 | Bromley | 49,261 | £93,595,900 | 494 | 0.35% |
| 31 | Bexley | 28,346 | £53,857,400 | 325 | 0.33% |
| 32 | Kensington and Chelsea | 18,351 | £34,866,900 | 225 | 0.26% |
| Totals | £5,130,516,800 | 36,861 | 1.00% | ||
As you can see, there are a number of other interesting statistics we can pull from this:
- Combined, the London-based local authorities spent in excess of £5 billion on new builds between Q3 2019 and Q2 2020
- Together, there were an estimated 36,861 new dwellings built during this period.
- 14 of London’s local authorities developed more than 1,000 new homes during the stated time period
Lastly, Chelsea may be a serial winner when it comes to football, but when it comes to housing development, it is rock bottom of the pile, with Bexley and Bromley just ahead of them.
That’s London ticked off, let’s go further north now…
Is Leeds the King of the North?
Excuse the Game of Thrones pun, but for many years now, Leeds has, genuinely, been considered the ‘London of the North’, and this latest data continues to support that.
Out of the 338 local authorities listed, Leeds may not have featured among the top growing but it did, however, invest the most during Q3 2019 and Q2 2020, spending an eye-watering estimate of £699,866,900 in housing construction and more than 5,000 new houses.
The latest data does mean that Leeds retains its place among the top five growing local authorities in the UK over the last decade. It’s also regularly considered as the best city to live in when it comes to quality of life, which would go along way in explaining why so many people are flocking towards it.
Unsurprisingly, another Northern powerhouse, Manchester, also features in this list following their biggest financial outlay in housing construction since 2015, investing approximately £540,831,200 – a whopping £220 million more than its previous top investment.
From the north, we’re going back down south… right down to the south coast!
Portsmouth may be in the bottom five, but that doesn’t tell the whole story
Play up Pompey! Portsmouth is one of the UK’s most historic cities and has got huge plans for business growth in the years to come.
These figures with regards to housing development, though, tell a different story.
Looking back at when records began – in 2008 – Portsmouth was one of the biggest growth areas in the UK, spending far more than three of the current top five – Brent, Vale of White Horse, and Bracknell Forest – in that year.
But while they may lie in the bottom five currently, it’s not because the city does not have the intention of growing. It’s actually because it can’t, not at the rate of some of the other big hitters in our list anyway.
Why? Well, for many years, Portsmouth has been regarded as the most densely populated area in the UK.
This latest information shows that with 90,780 the city sits within the top 100 local authorities for current dwellings and is a huge figure considering the city only has a total floor area of 11,191m2, the 12th lowest out of the 308 authorities included this data.
Regardless of that, Portsmouth has spent approximately £519,989,283 on housing construction since 2008, showing that it is not afraid of putting its money where its mouth is when the opportunity arises to invest in new housing projects.
Is Vale of White Horse becoming a UK hotspot?
Ok, we admit it. We had to Google where Vale of White Horse is. Don’t pretend you didn’t!
Famous for its expansive hills and rich history – apparently – there’s a reason that Oxfordshire has a great appeal when it comes to places to reside in the UK.
Vale of White Horse is part of the county and has repeatedly been voted as one of the country’s best places to live, a fact that is backed up by an article in the Oxford Mail just a few months ago.
Vale of White Horse has also been the only location in the current top five to show year-on-year growth with its housing construction expenditure – growing from £53,491,899 in 2011 to £346,162,900 in 2019.
That is a trend that is likely to continue into the future due to the sheer volume of space the area boasts.
Of the 308 local authorities, Vale of White Horse is in the top 15 for total floor area – 154,270m2 – which is being filled by just over 58,000 dwellings, meaning there is far more room for potential growth in the years to come.
Join the conversation!
We’re a lively bunch and you can bet that we’re going to be talking about this a lot more over on our social channels.
Do you live in one of these top five areas, or even in one of the bottom five? Have you bought a new build in the last year? If so, is it up to scratch? Maybe you think this data is all lies! Whatever it is, come along and join us on our Facebook and Twitter channels.
And finally, if you’re interested, the full data can be accessed here! Enjoy!
NOTE: There are 338 local authorities across the UK. Minor differences in definitions of Local Authority between data sources prevented matching in 30 local authorities.
Header image credit: NKLato/Shutterstock.com